

Initialize tracing with one call
Calltracing.init() once at startup. It configures an OpenTelemetry tracer provider, connects to Surface Area from your environment, and instruments installed AI libraries.
init() finds your Surface Area project from three environment variables. Set them before the process starts.
Copy the host and generate a key pair from your project’s Settings page.
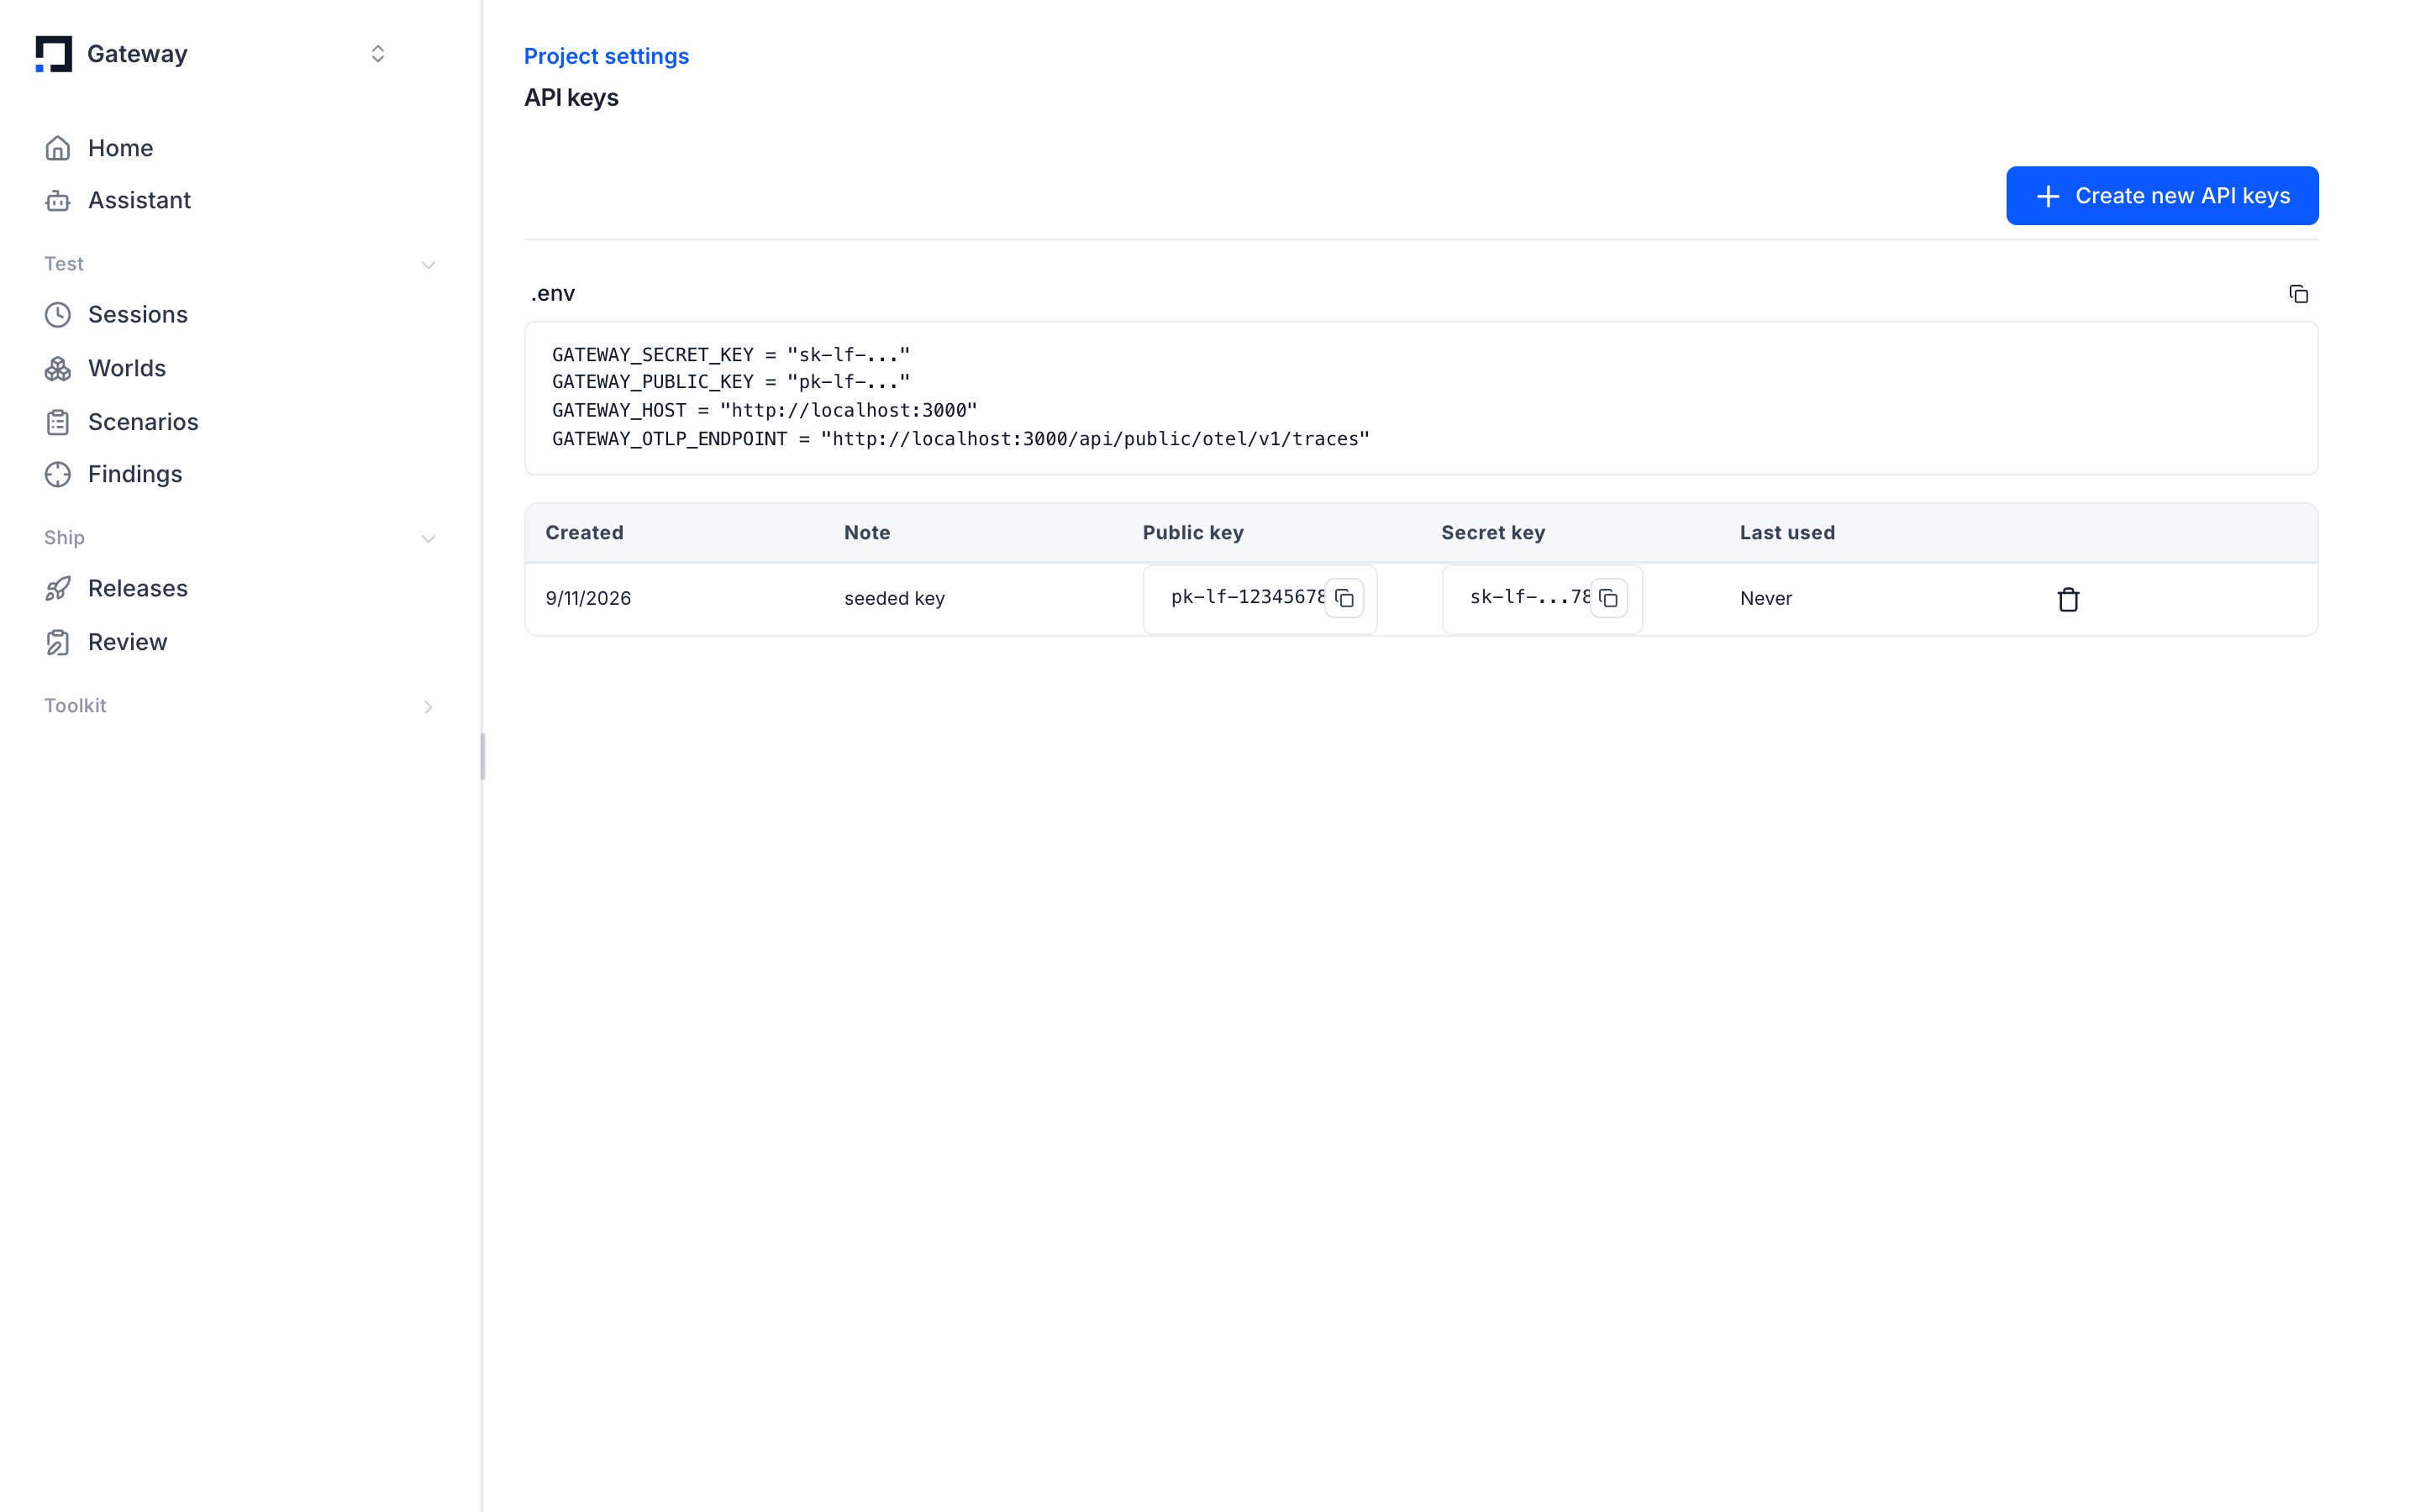
GATEWAY_HOST, and create your pk-lf-… / sk-lf-… keys under the API keys tab.
With the three required variables set, the SDK builds the export URL automatically by appending
/api/public/otel/v1/traces to the host. Override that path only with GATEWAY_OTLP_ENDPOINT or the gateway_endpoint parameter. See Export to Surface Area for details.Pass credentials directly instead of environment variables
Provide the host and keys as arguments when the environment is not an option. Read them from your own configuration. Never hardcode secrets in source.Useful init parameters
init() is keyword-only.
Pass
debug="INFO" while you set tracing up. It logs the init summary, instrumentor activation, and export success or failure, without the full firehose of True.Flush spans before the process exits
Spans are batched and exported in the background. Calltracing.shutdown() before the process exits so pending spans are flushed; otherwise a short-lived script can drop its last traces.
tracing.flush() to force export at a checkpoint without ending the session.
Trace a function with a decorator
Apply@tracing.trace to a function to capture its input and output as a span. The span name defaults to the function name.
Trace a block with a context manager
Usetracing.trace as a context manager to start a root span and set input and output explicitly. The block yields the OpenTelemetry span, so you can attach attributes to it.
tracing.span() calls to record sub-steps as child spans. Each child appears under the active trace in the call tree.
tracing.tool(). It marks the span as a client call and adds a tool.name attribute.
Async code has matching context managers:
tracing.atrace() for a root span and tracing.aspan() for a child span. They behave like their synchronous counterparts.Errors are recorded automatically
Thetrace, span, and tool context managers record exceptions for you. If the block raises, the exception is recorded on the span and its status is set to error before the exception propagates.
set_status on the yielded span. It is a standard OpenTelemetry Span.
A complete traced agent
1
Set your Surface Area connection
2
Write the agent
3
Run it and open the dashboard
Run the script, then open your project in Surface Area. The
faq-bot trace appears with its nested lookup span.Where to go next
- Auto-instrumentation: capture LLM and agent-framework calls with no span code.
- Metadata & identity: attach users, agents, tags, and custom metadata.
- Sessions & traces: group related runs into one session.