> ## Documentation Index
> Fetch the complete documentation index at: https://docs.surfacearea.ai/llms.txt
> Use this file to discover all available pages before exploring further.
# What is tracing
> Capture what your agent did (every LLM call, tool call, and step) and send it to Surface Area for inspection and evaluation.
Tracing records what your agent did at runtime -- every LLM call, tool call, and step -- and ships the record to Surface Area. Once a trace lands, you can inspect it, evaluate it, and seed a world from it.
The `gatewaysdk.tracing` module instruments your agent with [OpenTelemetry](https://opentelemetry.io/) and exports the spans to your Surface Area project. Setup is one call, and the SDK captures calls to common LLM libraries with no extra code.
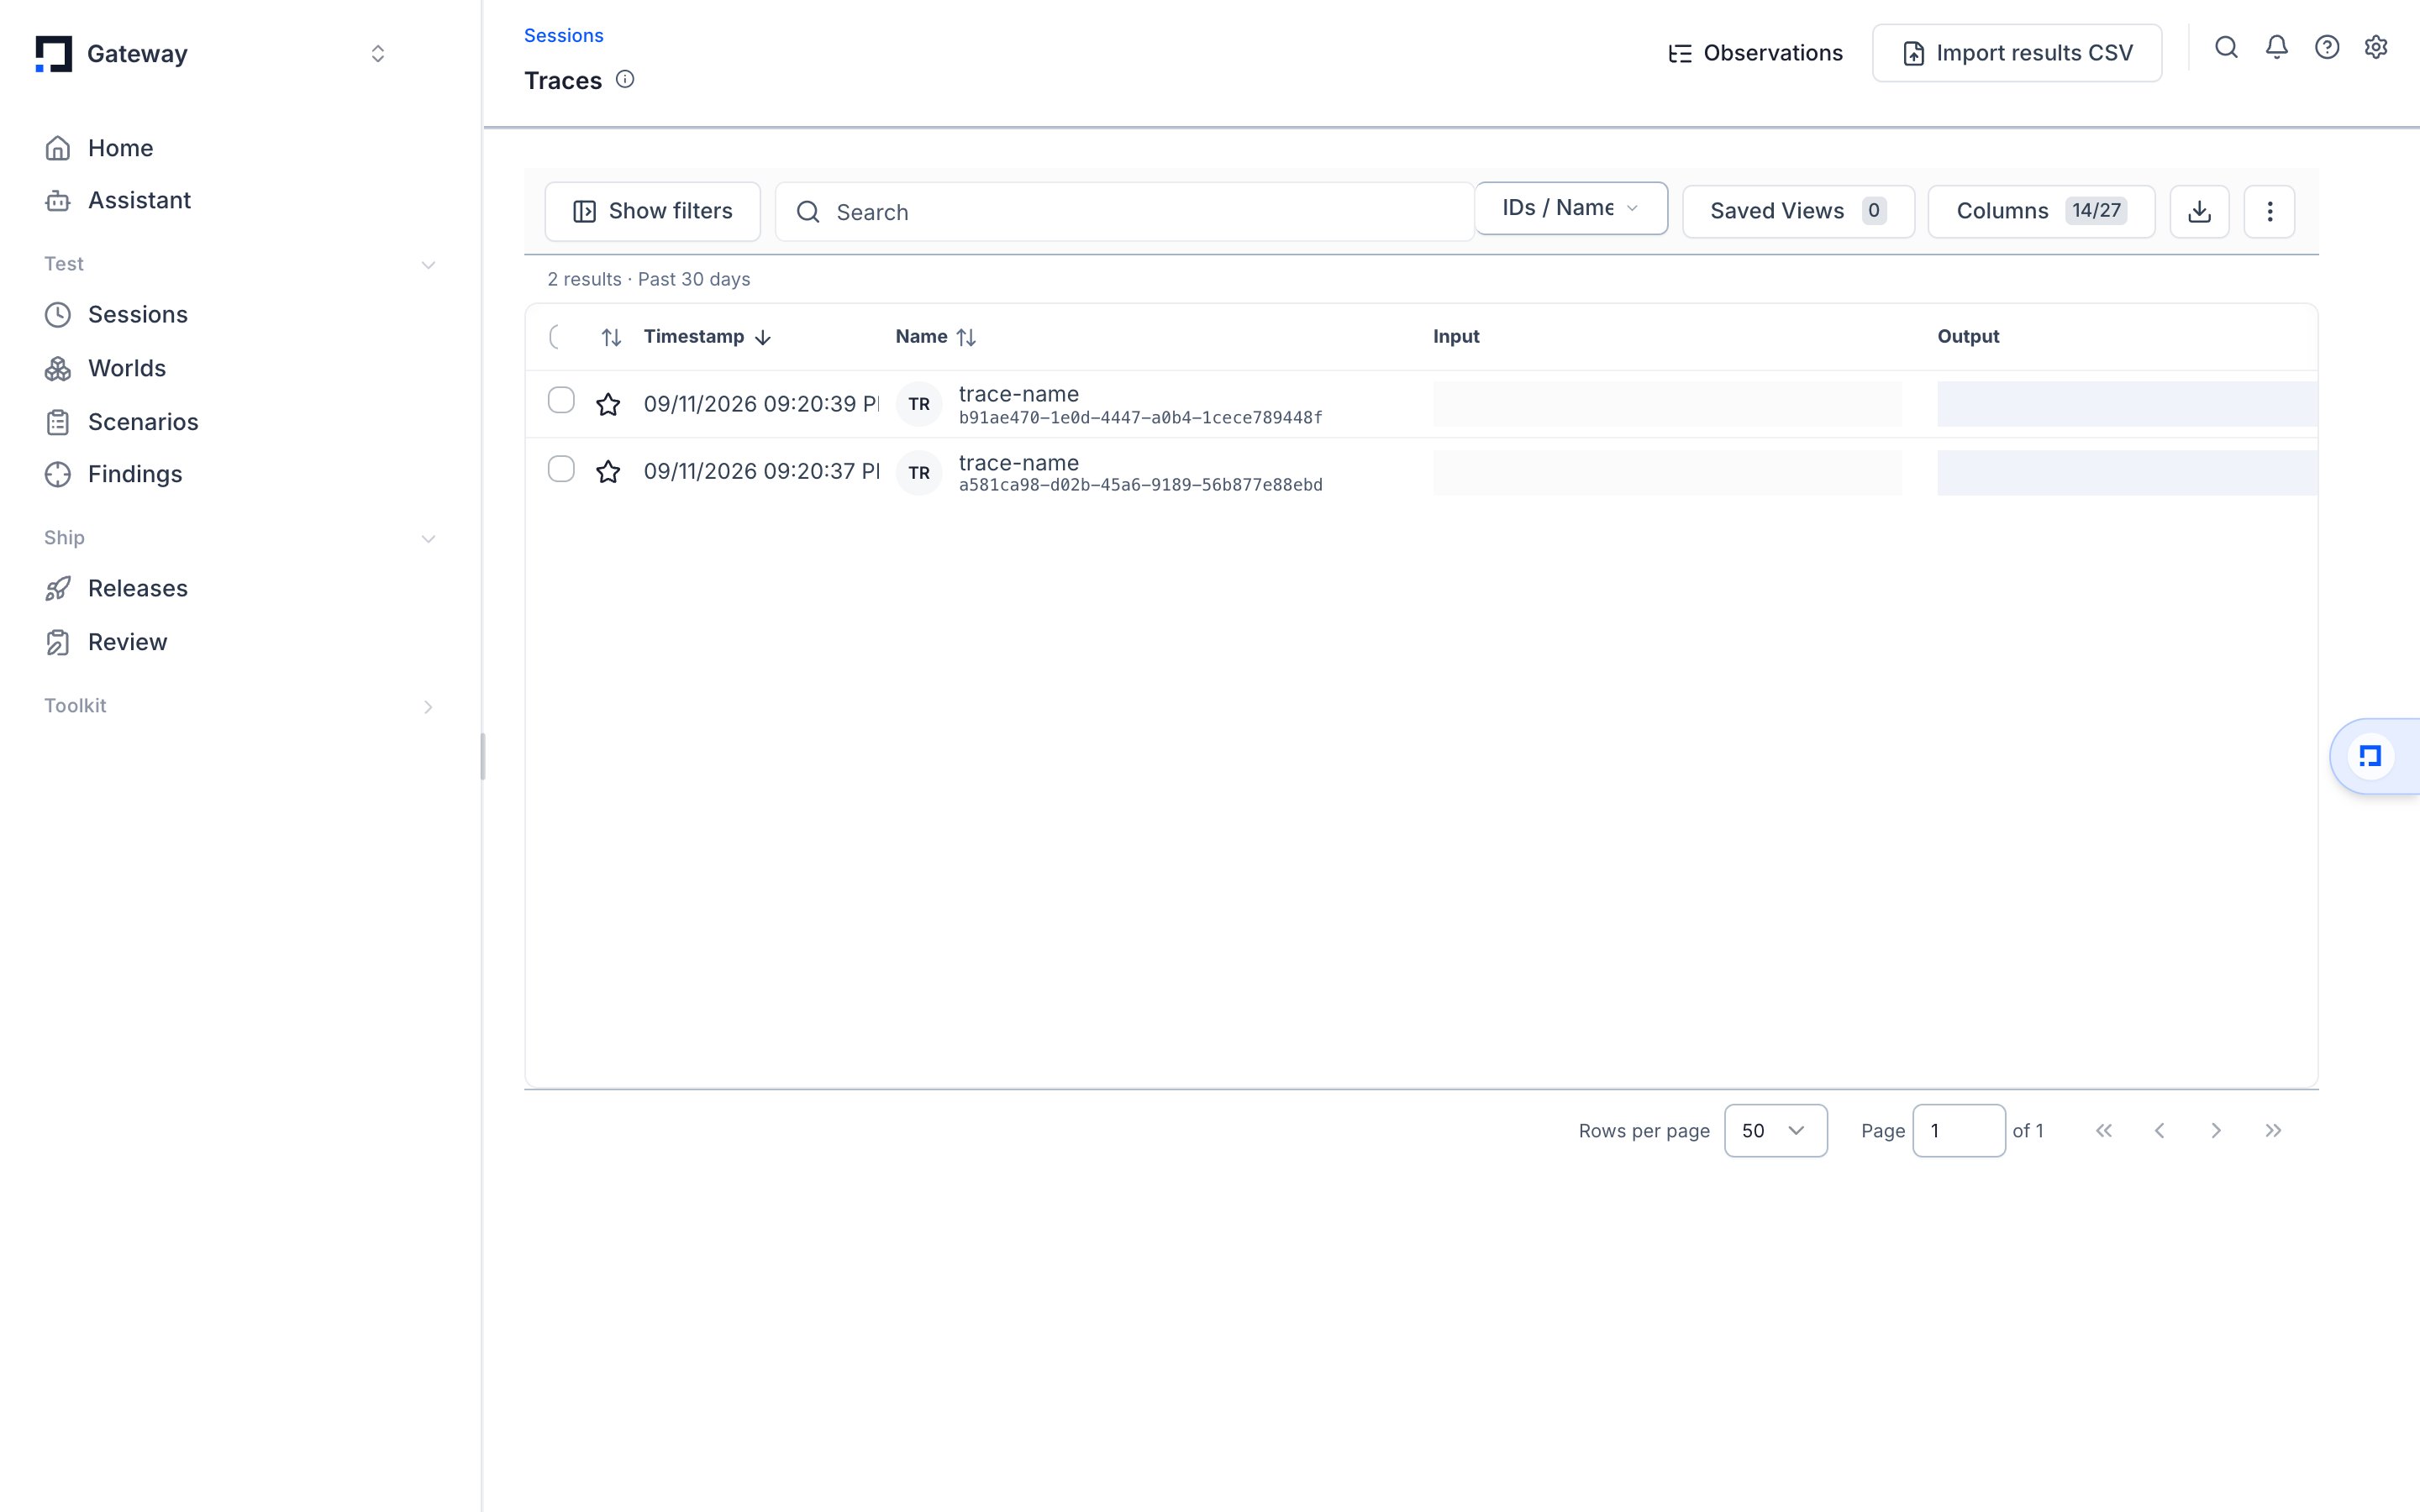 *Each traced run lands in Surface Area as a row, with its name, input, and output.*
## Traces and spans
A **span** is one timed unit of work: an LLM call, a tool call, a function, a retrieval step. Each span has a name, a start and end time, and attributes describing what happened.
A **trace** is a tree of spans for one agent run. The root span is the run; child spans are the steps inside it.
Spans are created three ways: automatically by auto-instrumentation, with the [`@tracing.trace` decorator](./setup), or with the [`tracing.trace` / `tracing.span` context managers](./setup). All three produce ordinary OpenTelemetry spans.
## Traces versus sessions
A **session** groups several traces into one conversation or workflow.
Every trace belongs to a session even when you write no grouping code. Set a session id explicitly to tie specific runs together, for example all the turns of one chat thread. See [Sessions & traces](./sessions) for how grouping works.
| Unit | Scope | Use it for |
| - | - | - |
| Span | One step (LLM call, tool call, function) | A single step's input, output, latency, or cost |
| Trace | One agent run (a tree of spans) | Debugging one run end to end |
| Session | Many traces (a conversation or workflow) | The whole multi-turn interaction |
## OpenTelemetry under the hood
Surface Area tracing is standard OpenTelemetry. `tracing.init()` configures an OpenTelemetry `TracerProvider`, and spans are exported over OTLP (the OpenTelemetry Protocol) via HTTP to a Surface Area ingestion endpoint.
Two consequences follow. Spans created by any OpenTelemetry-compatible instrumentor flow to Surface Area alongside your own, and the spans you create with `tracing.span()` are plain OpenTelemetry `Span` objects you can attach attributes to directly.
Because export is OTLP, the spans Surface Area ingests are the same spans any OpenTelemetry backend would receive. Surface Area adds its own attribute conventions (the `gateway.*` namespace) on top, which power the dashboard's input/output, user, and session views.
## Where to go next
* [Instrument an agent](./setup): initialize the SDK and add spans with the decorator and context-manager APIs.
* [Sessions & traces](./sessions): group related runs into one session.
* [Auto-instrumentation](./auto-instrumentation): the LLM and agent frameworks the SDK captures automatically.
* [Metadata & identity](./metadata): attach users, agents, tags, and custom metadata to spans.
* [Export to Surface Area](./export): configure where spans go and how they are batched.
This documentation is built and hosted on [Mintlify](https://mintlify.com), a developer documentation platform.
*Each traced run lands in Surface Area as a row, with its name, input, and output.*
## Traces and spans
A **span** is one timed unit of work: an LLM call, a tool call, a function, a retrieval step. Each span has a name, a start and end time, and attributes describing what happened.
A **trace** is a tree of spans for one agent run. The root span is the run; child spans are the steps inside it.
Spans are created three ways: automatically by auto-instrumentation, with the [`@tracing.trace` decorator](./setup), or with the [`tracing.trace` / `tracing.span` context managers](./setup). All three produce ordinary OpenTelemetry spans.
## Traces versus sessions
A **session** groups several traces into one conversation or workflow.
Every trace belongs to a session even when you write no grouping code. Set a session id explicitly to tie specific runs together, for example all the turns of one chat thread. See [Sessions & traces](./sessions) for how grouping works.
| Unit | Scope | Use it for |
| - | - | - |
| Span | One step (LLM call, tool call, function) | A single step's input, output, latency, or cost |
| Trace | One agent run (a tree of spans) | Debugging one run end to end |
| Session | Many traces (a conversation or workflow) | The whole multi-turn interaction |
## OpenTelemetry under the hood
Surface Area tracing is standard OpenTelemetry. `tracing.init()` configures an OpenTelemetry `TracerProvider`, and spans are exported over OTLP (the OpenTelemetry Protocol) via HTTP to a Surface Area ingestion endpoint.
Two consequences follow. Spans created by any OpenTelemetry-compatible instrumentor flow to Surface Area alongside your own, and the spans you create with `tracing.span()` are plain OpenTelemetry `Span` objects you can attach attributes to directly.
Because export is OTLP, the spans Surface Area ingests are the same spans any OpenTelemetry backend would receive. Surface Area adds its own attribute conventions (the `gateway.*` namespace) on top, which power the dashboard's input/output, user, and session views.
## Where to go next
* [Instrument an agent](./setup): initialize the SDK and add spans with the decorator and context-manager APIs.
* [Sessions & traces](./sessions): group related runs into one session.
* [Auto-instrumentation](./auto-instrumentation): the LLM and agent frameworks the SDK captures automatically.
* [Metadata & identity](./metadata): attach users, agents, tags, and custom metadata to spans.
* [Export to Surface Area](./export): configure where spans go and how they are batched.
This documentation is built and hosted on [Mintlify](https://mintlify.com), a developer documentation platform.